#BetterPosters
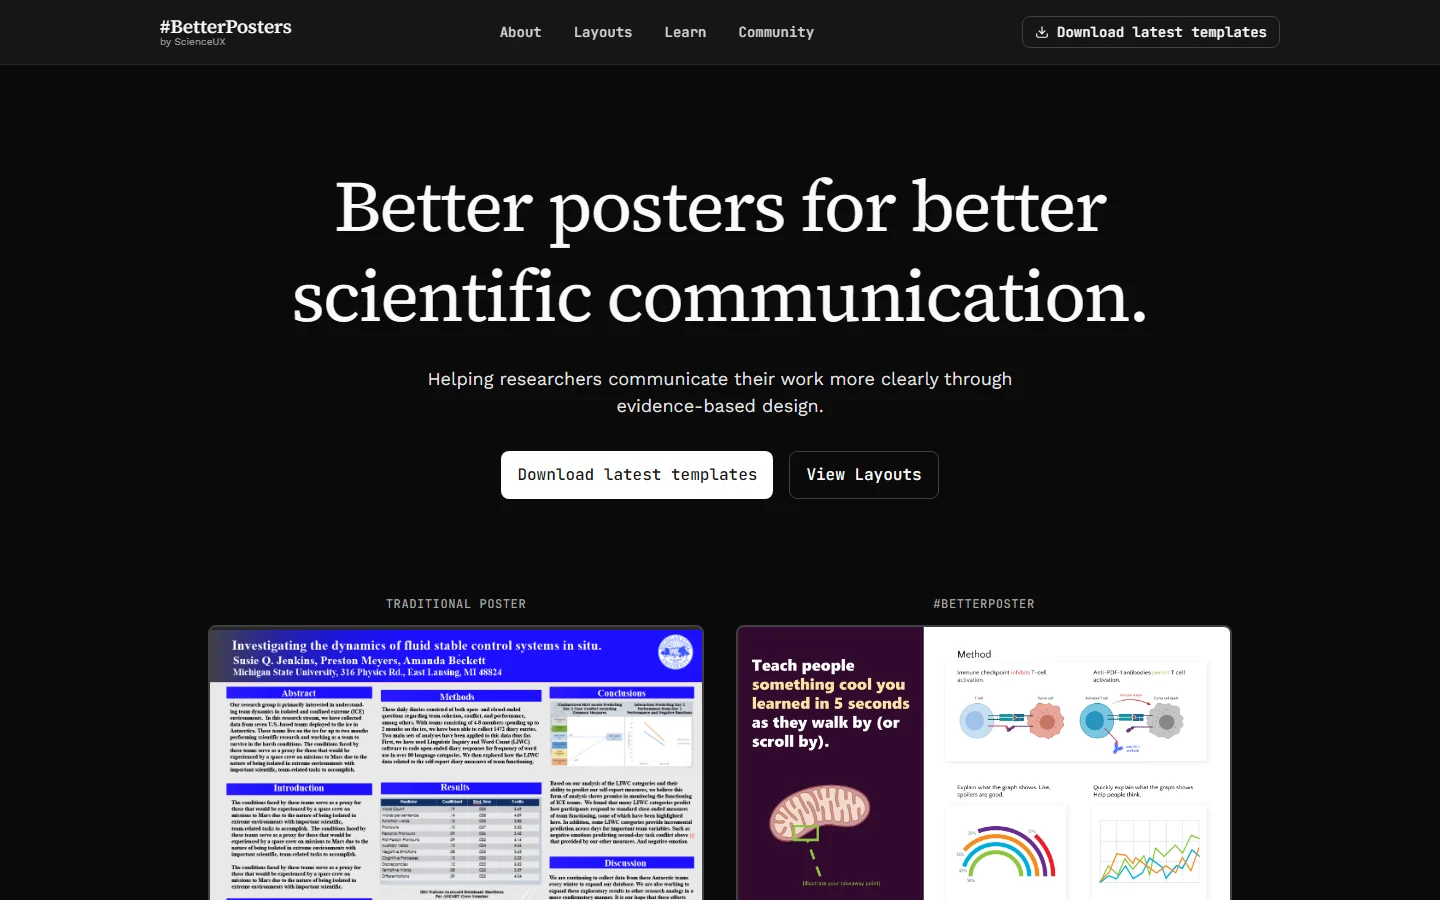
Evidence-based scientific poster templates helping researchers communicate clearly through thoughtful design.
80+ members
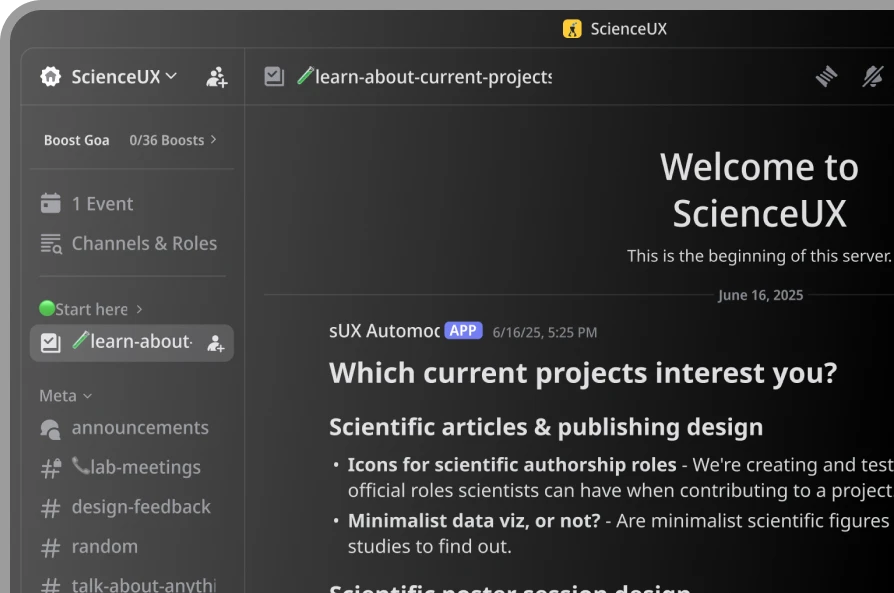
Join the group of scientists, designers, researchers, and developers working on open tools that make science clearer and better for everyone.
Designers, scientists, developers, and tinkerers. Bring what you know, bring what you want to learn, and bring a little curiosity.
Why contribute?
Help shape how science is understood, shared, and experienced. Work on real projects, learn by doing, and leave your mark.
I came for the projects and stayed for the people. Everyone here is generous with what they know, and I've grown more as a researcher than I expected to.
How it works
No formal interviews or rigid obligations. You set your pace and involvement.
Drop an intro in the welcome channel, or simply explore the conversations taking place.
IntroductionAn informal 1:1 chat with Mike or Michael to hear what you care about and want to learn.
PersonalizationPick an existing open task, pair with another member, or start your own exploratory project.
Choose your trackWork asynchronously, get feedback, learn new tools, and make real impact for science.
Async & flexibleOpen for all to join. Wednesdays · 5:30 PM IST (optional & casual).
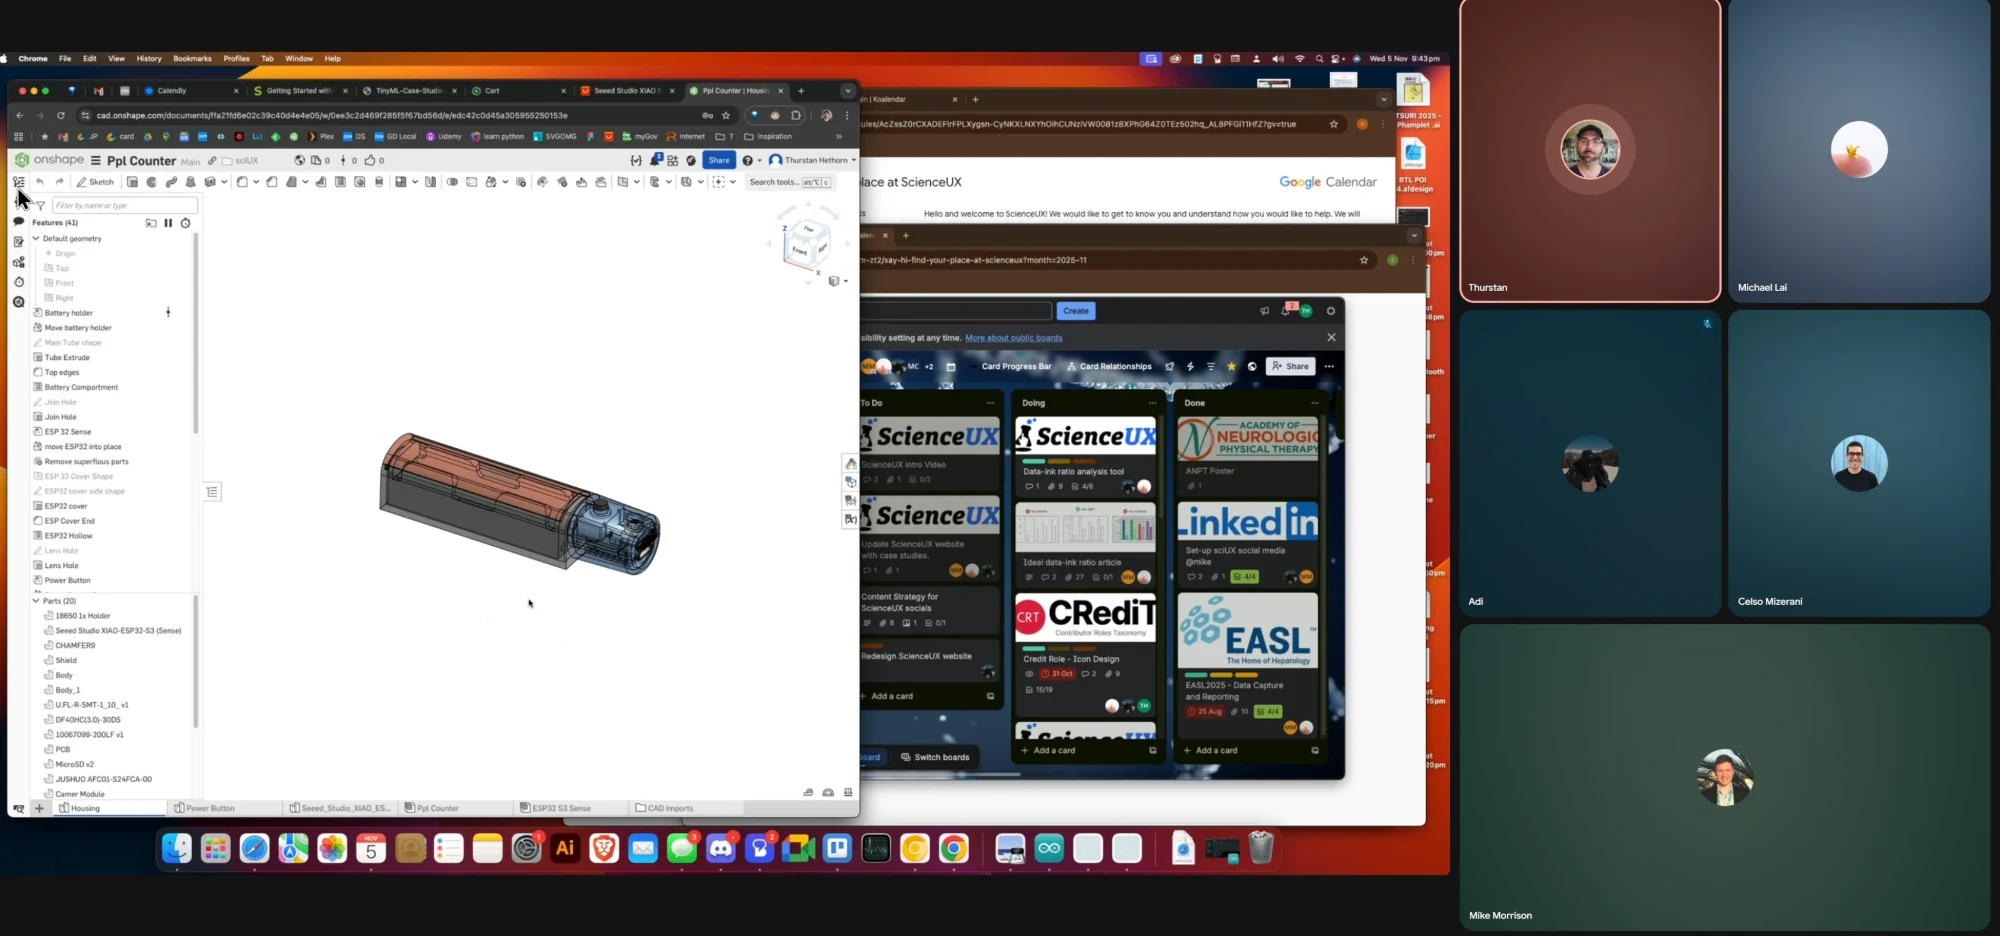
Get guidance from Mike Morrison, PhD (Psychology) aka BetterPosters Guy, and Michael Lai, UX Stack Exchange moderator.

Mike Morrison
BackgroundDesigner turned Psychologist
What I'm intoScientific communication, research
Fun FactThe BetterPoster guy

Michael Lai
BackgroundScientist turned designer
What I'm intoDesign (Data viz)
Fun FactSkilled in origami
Contribute whenever suits your schedule and timezone. We maintain all projects & tasks on Linear.
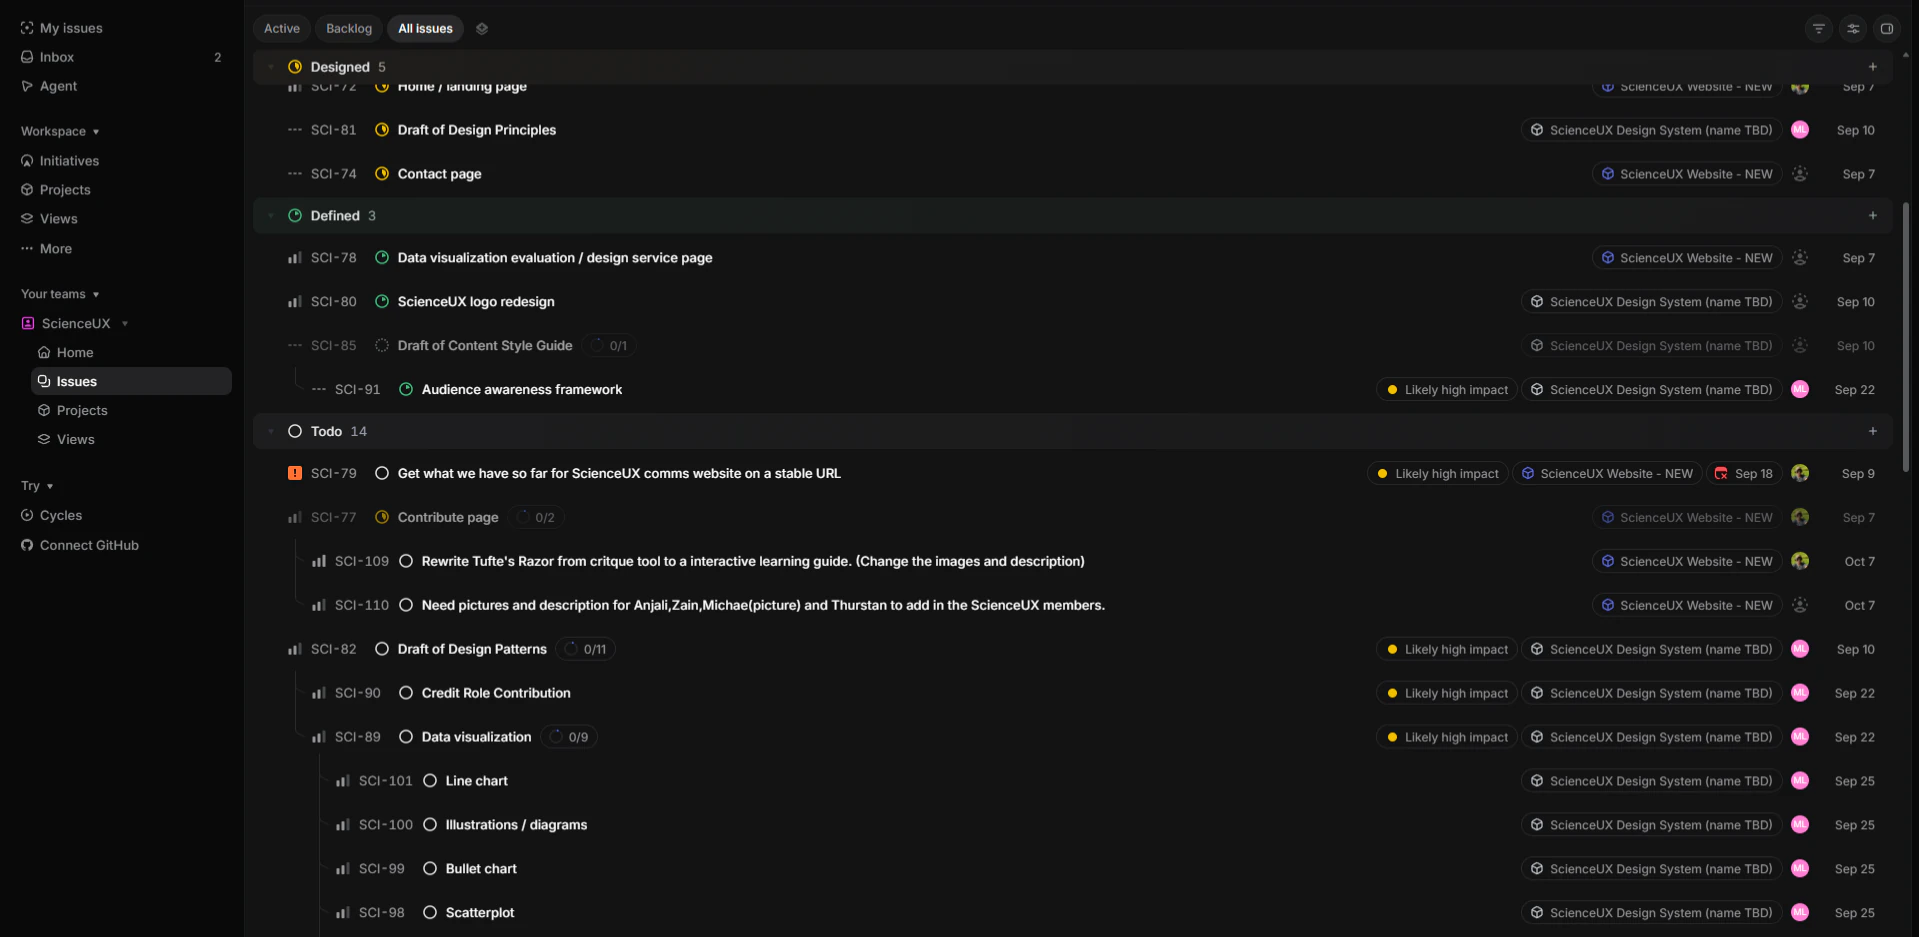
Connect with people and collaborate on projects and discussions on the server.
Selected work
Evidence-based scientific poster templates helping researchers communicate clearly through thoughtful design.
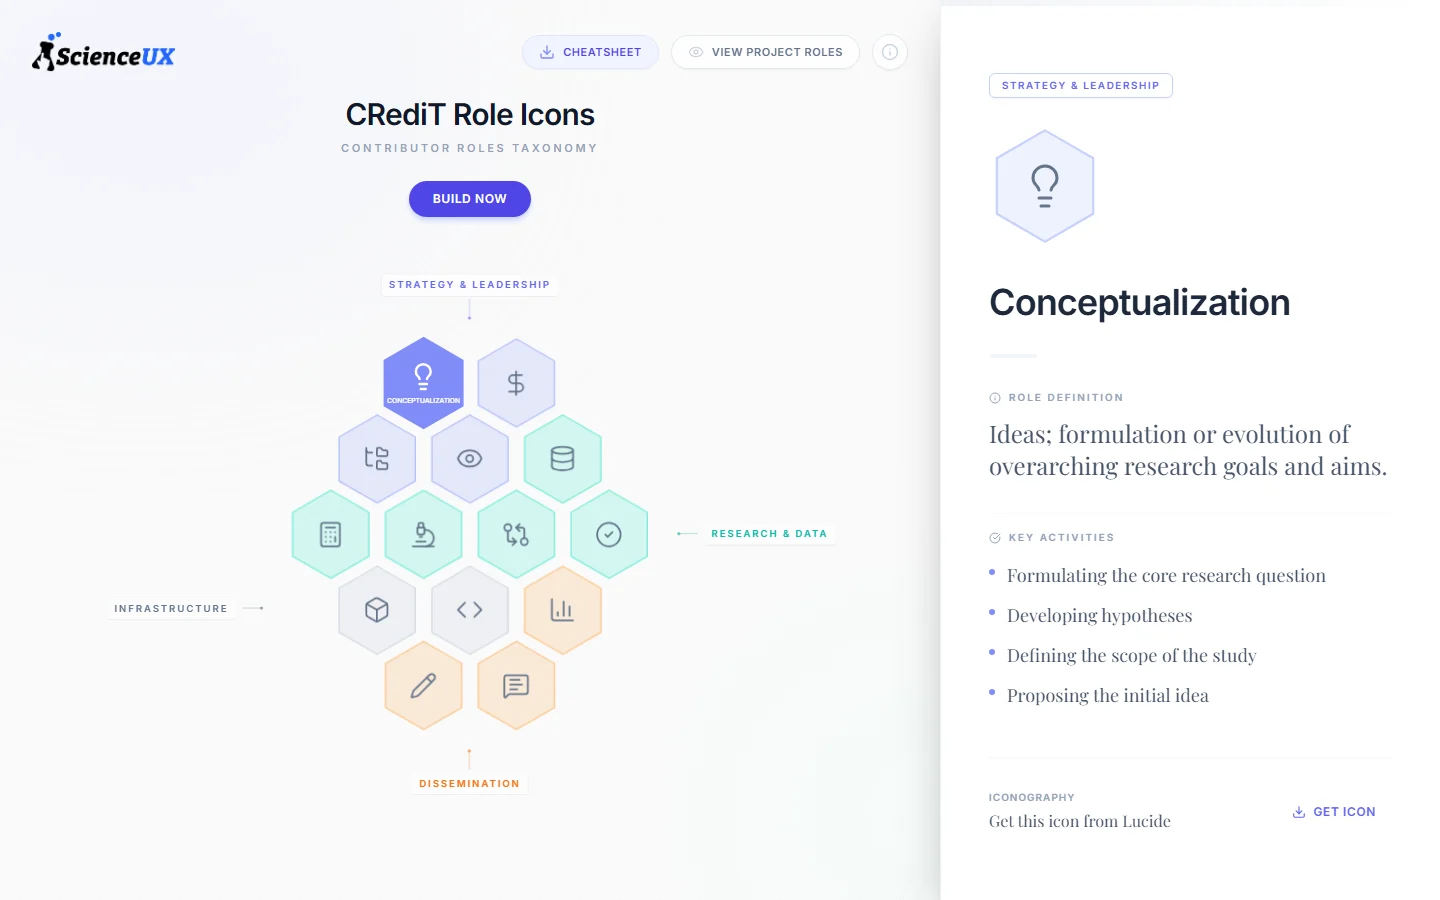
The CRediT Role Icon Project explores how better UX can increase CRediT adoption and awareness among journals and authors.
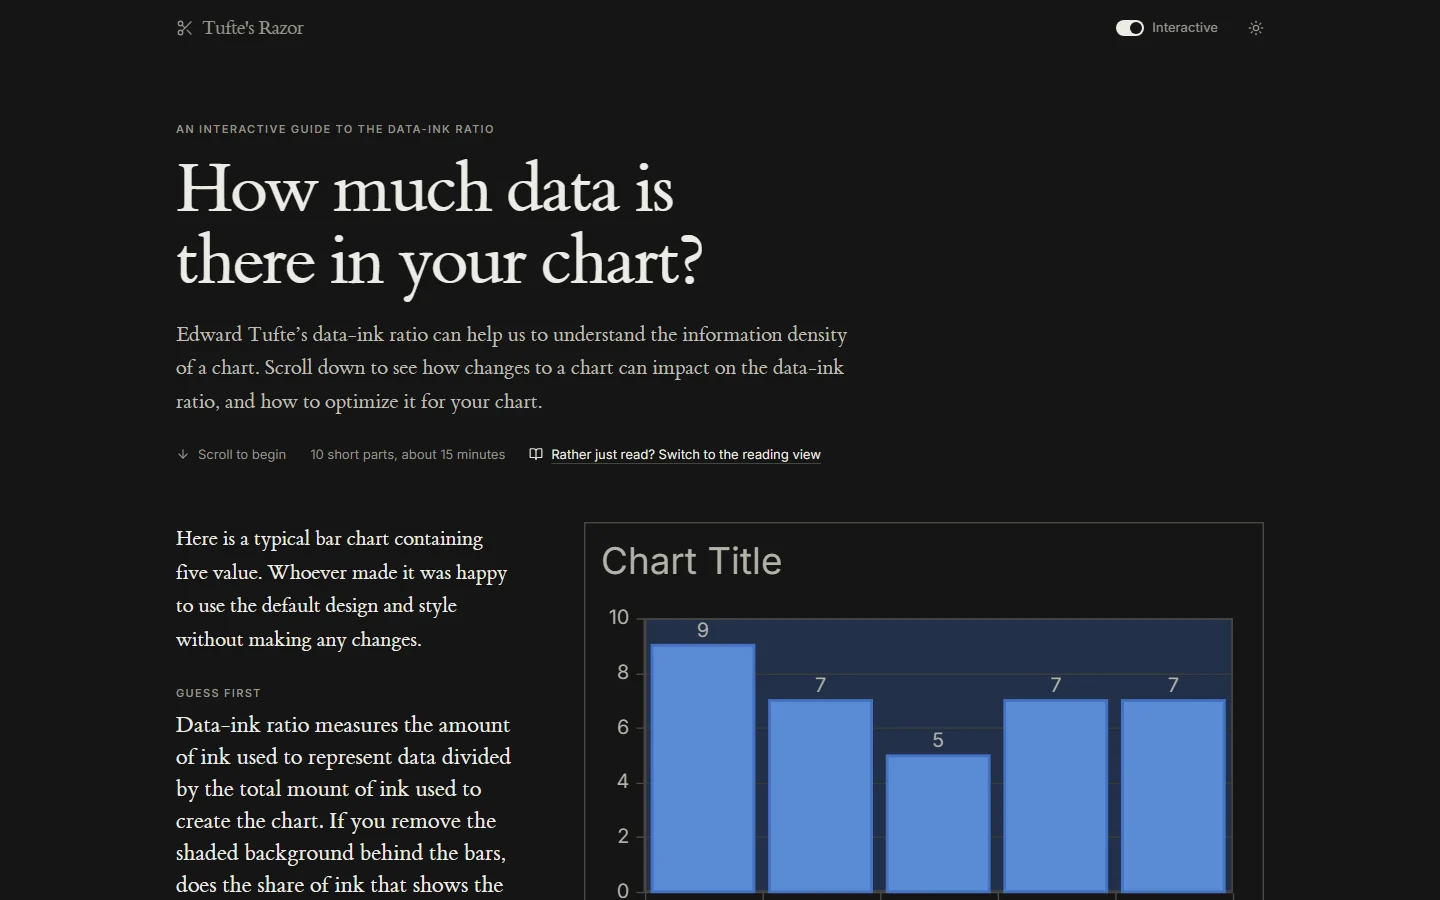
An interactive guide to Edward Tufte's data-ink ratio. Guess first, then strip a cluttered chart back one change at a time and watch how much of its ink starts showing data.
Join 80+ scientists, designers, developers, and curious people building, sharing, and learning together. Our Discord is a supportive space to contribute to open projects and explore better ways to communicate science.